Visa And Mastercard – same business, different results
I don’t think there’s much of an argument when Visa (NYSE:V) and Mastercard (NYSE:MA) are labeled wonderful businesses. They both operate like tollbooths – largely due to their dominant market share, the highly regulated industry they operate in with high barriers of entry, their technological „know-how”, and their hard-to-reproduce size and scale. These companies are often lumped together in the minds of investors, as they appear to run identical business models, but I think they’re different in many ways as well – especially when examining their respective returns on equity.
A DuPont analysis reveals the differences
I created the below charts using data from Visa and Mastercard’s 2017 10-K forms. I also decided to use the adjusted, non-GAAP numbers (excluding things like charges and one-time items) provided by the management of both companies in their respective 10-Ks.
The information I used for adjusted net income (and also to extrapolate pretax income, or EBT, and operating profit, or EBIT, using the adjusted operating margins and adjusted effective tax rates) can be found on page 35 of Visa’s annual report and page 37 of Mastercard’s. Assets, equity, and revenues were not adjusted for this analysis.
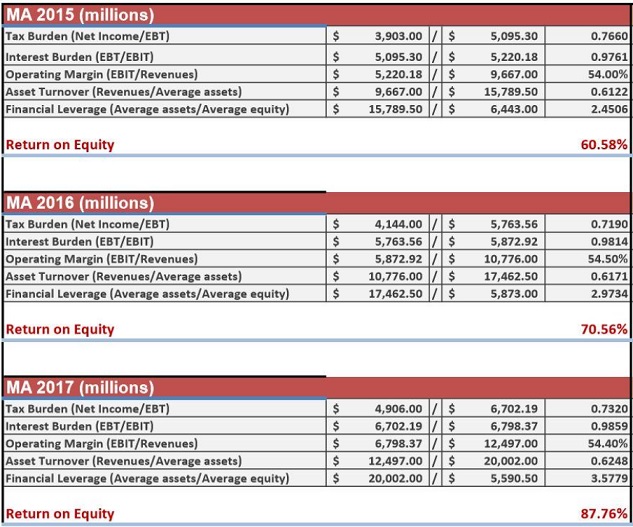
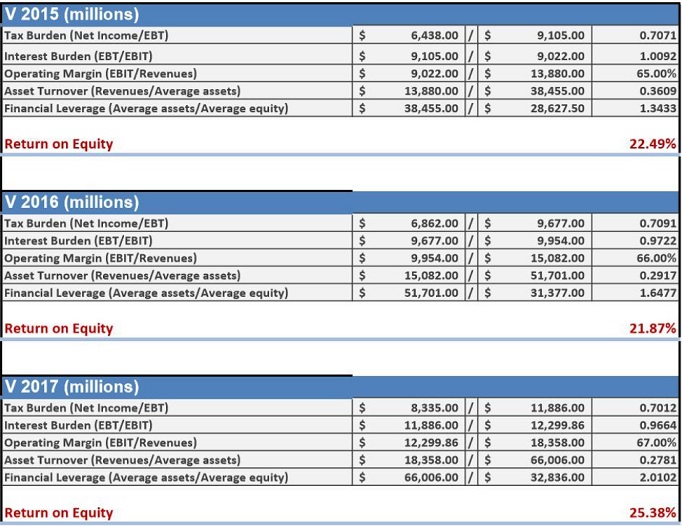
Despite nearly identical business models (and similar tax rates and interest burdens), the difference between the two companies can immediately be felt when examining their respective returns on equity. Mastercard’s absurdly high ROE of 87.76% initially looks much more attractive than Visa’s ROE of only 25.38%, but there’s also more to this picture.
Visa owns the higher margins, which probably reflect its economies of scale. Mastercard’s margins are also attractive, but they’re simply lower. Mastercard more than makes up for this, however, with greater efficiency. It’s improved its asset turnover ratio sequentially over the past three years – reaching 0.62x in fiscal 2017.
This compares to Visa’s asset turnover of only 0.28x in its fiscal 2017 – the third straight year of this efficiency ratio declining. Visa’s assets have grown faster than its revenues, and its acquisition of Visa Europe probably contributed to this trend.
Visa’s balance sheet is loaded with a lot more „air” – aka goodwill and intangibles – in relation to Mastercard. Neither firm really relies on physical PP&E like say, a railroad, but there’s definitely a wide discrepancy between Mastercard’s and Visa’s balance sheets when filtered through this lens.
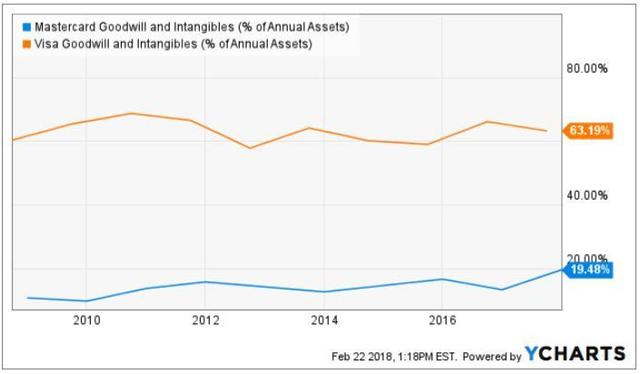
This could also help partially explain why Mastercard’s asset turnover ratio is superior, which is also a major contributing factor to its ability to generate vastly superior ROE in relation to its larger competitor. This also tells me that margin expansion would increase Mastercard’s figures much more as well.
Besides superior asset turnover, Mastercard also operates with higher financial leverage than Visa. Leverage magnifies ROE, pushing it higher as the leverage increases. It should be noted that both firms have stepped up the leverage sequentially over the past three fiscal years, but Visa’s ratio remains much lower.
If we were to perform a „thought experiment” and set the leverage ratio to 1x for both companies and hold everything else constant, however, Mastercard’s ROE would come in at around 24.53% – still almost doubling Visa’s at only about 12.63%.
Conclusion
Visa is still king of payments when it comes to margins and size and scale. It probably even wins at brand awareness. Mastercard, however, efficiently generates more revenue from its asset base and operates with more leverage, allowing it to achieve enviably high ROE that is vastly superior to Visa’s. Even when placing leverage on a „level playing field,” Mastercard still appears to be the superior capital allocator.
In the end, I think both businesses dominate a duopoly that allows them to generate outsized returns on their overall invested capital. They’re both above-average operations and they’re also both classic tollbooth businesses – but they’re not exactly identical twins, either.
Disclosure: I am/we are long V.
Source: Joseph Harry articles on seekingalpha.com


Dariusz Mazurkiewicz – CEO at BLIK Polish Payment Standard
Banking 4.0 – „how was the experience for you”
„To be honest I think that Sinaia, your conference, is much better then Davos.”
Many more interesting quotes in the video below: