![]()
![]()
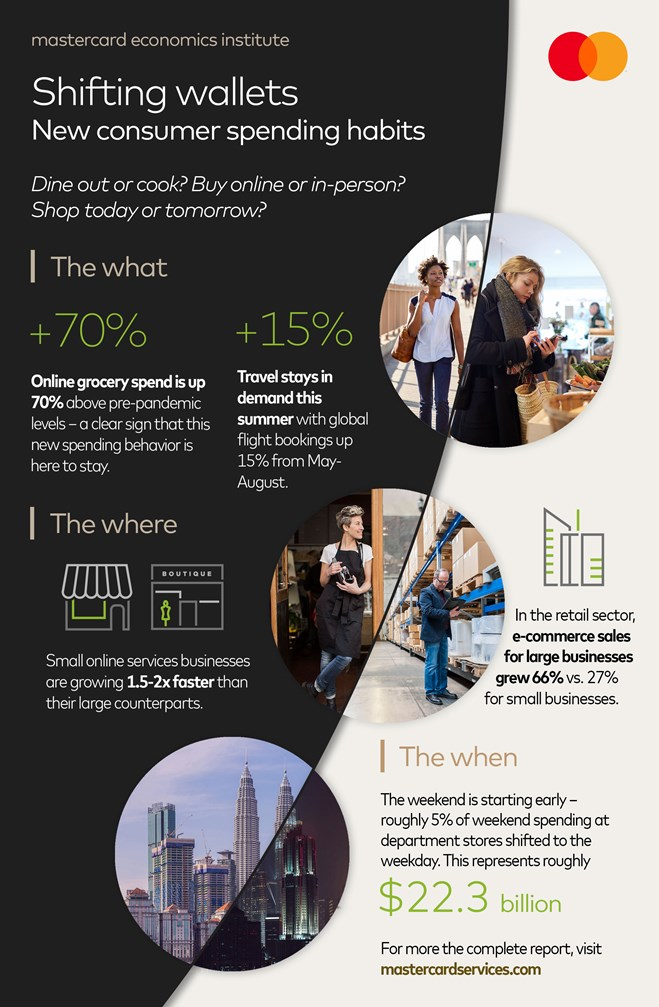
Spending on grocery online surges 70% above pre-pandemic levels.1
Global consumer flight bookings throughout this summer stayed 15% above 2019 levels.2


Remote work trends impact how we live and where we spend – as a result, the „weekend” is starting early.
Amidst an ever-changing and unprecedented global economy, the choices consumers make in what, where and when they spend today may help reveal where we are headed next. The Mastercard Economics Institute’s “Shifting Wallets” report looks at how consumers across the world are holding tight to habits that offer convenience, experience or both.
The latest Mastercard Economics Institute report applies unique and high-frequency economic measurements to answer three key questions — what, where and when — consumers are shifting their spending preferences. Key findings include:
What: With higher prices forcing consumers to rebalance their discretionary and essential spending, travel and food have reigned supreme in discourse in recent years.
Consumers continue to prioritize travel. Global consumer flight bookings this summer (May-August) were 15% above 2019 levels, despite heightened logistical challenges and price pressures.2
Short haul flights fuel most of the travel growth globally (+20% compared to long)3 except in European countries where travelers have good alternatives to flying for shorter trips.
The ease of eating out draws diners. Restaurant spending was up 25% this year compared to the same time in 2021, while grocery spending—largely fueled by food inflation—was up 14%.4
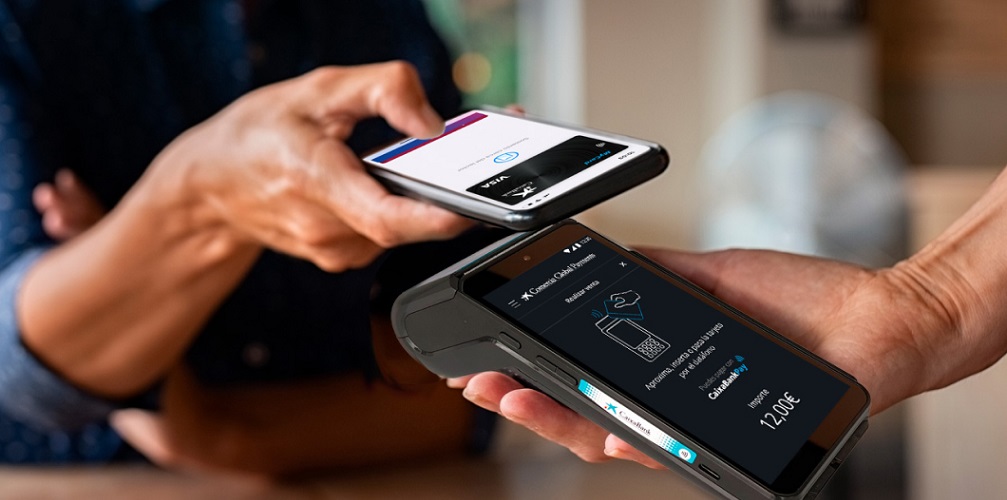
When looking at longer term trends, online grocery spend is up 70% above the pre-pandemic trend, while in-person grocery spend sits 25% above.1 This speaks to the pandemic-fueled shift to digital and the stickiness of convenience-based spending.
Where: Small businesses bore the brunt of pandemic-related closures, as they tried to rapidly shift online.
Small businesses show gains in online services. Small online services businesses—think tax preparation, tutoring and personal care services—are growing 1.5-2x faster than large online services businesses.5 This is especially true in Belgium, Brazil, Canada, Italy, and Singapore.
Large retailers dramatically outperform small businesses in the shift to digital. In the retail sector, e-commerce sales for large businesses grew 66% versus 27% for small businesses in August compared to 2019.6 The gap is particularly evident in more developed economies like Australia, Germany, Hong Kong and Singapore.
When: Gone are designated days for spending. Working from home and the shift to digital have blurred the lines, and date night is apparently now any night. This has significant staffing and supply chain implications for retailers, restaurants and other businesses.
Both goods and experiences spending shifts into weekdays.
Globally, roughly 5% of total weekend spending at department stores has shifted into the weekday. This represents roughly $22.3 billion USD of global department store sales.7
In the U.S., a clear weekend to weekday shift in spending at movie theatres, where a cumulative 3 percentage points have shifted away from Saturdays and Sundays into the weekdays – mostly on Thursdays and, to a lesser extent, Mondays too.
“The shifts in spending preferences come as consumers settle in to a new rhythm,” said Bricklin Dwyer, Mastercard chief economist and head of the Mastercard Economics Institute. “Despite contending with rising prices, interest rates and growing economic uncertainty, consumers continue to evaluate their spending habits based on what works best for their lives.”
You can view the full Shifting Wallets: New consumer spending habits report here. Other reports from the Mastercard Economics Institute can be found here.
_____________
1 Reflects the deviation above the pre-pandemic trend. Measures aggregated & anonymized Mastercard switched volumes (nominal US dollars unadjusted for FX) for the month of August 2022. Seasonally adjusted global estimate.
2 Corresponds with the number of flight bookings made during reference period relative to the same time in 2019. Based on aggregated & anonymized flight booking data provided by third party partners, sourced by Mastercard Economics Institute.
3 Corresponds with the number of flight bookings made relative to the same time in 2019 for the month of August 2022. Based on aggregated & anonymized flight booking data provided by third party partners, sourced by Mastercard Economics Institute.
4 Reflects the YTD growth rate of aggregated & anonymized Mastercard switched volumes (nominal US dollars unadjusted for FX) through August 2022 YTD. Seasonally adjusted and price adjusted global estimate.
5 Figures reflect aggregated & anonymized Mastercard switched volumes (nominal US dollars unadjusted for FX) for the month of August 2022. Reflects a cross-country average of small & medium-sized versus large retailers and service businesses across 22 countries. Small and medium-sized businesses derived by a proprietary classification model developed by the Mastercard Economics Institute.
6 Figures reflect aggregated & anonymized Mastercard switched volumes (nominal US dollars unadjusted for FX) for the month of August 2022. Reflects a cross-country average of small & medium-sized versus large retailers and service businesses across 22 countries. Small and medium-sized businesses derived by a proprietary classification model developed by the Mastercard Economics Institute.
7 Source: Mastercard Economics Institute, Euromonitor. Reflects weekend to weekday share shift derived by aggregated & anonymized Mastercard switched volumes (nominal US dollars unadjusted for FX) as of August 2022 YTD. The change in share corresponds with the change in the average share of spending by day of the week in 2019 versus the average share of spending by day of the week in 2022. Global market size for department stores sourced through Euromonitor. Assumes day of the week share shift is representative across all tender types.


Banking 4.0 – „how was the experience for you”
„To be honest I think that Sinaia, your conference, is much better then Davos.”
Many more interesting quotes in the video below: