66% of internet users in the EU shopped online in 2016

Two thirds of internet users in the 12 months prior to the survey (hereafter referred as „internet users”) made online purchases in the same period. Overall, the share of e-shoppers in internet users is growing, with the highest proportions being found in the 16-24 and 25-54 age groups (68 % and 69 % respectively).
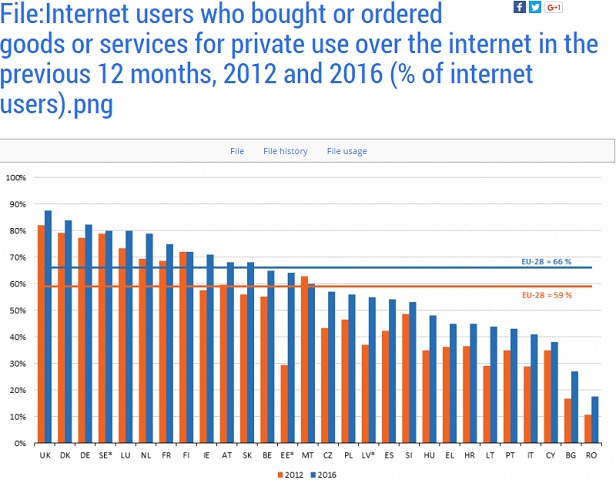
The proportion of e-shoppers varied considerably across Member States, ranging from 18 % of internet users in Romania to 87 % in the United Kingdom.
The most popular type of goods and services purchased online in the EU was clothes and sport goods (61 % of e-buyers), followed by travel and holiday accommodation (52 %). E-shoppers aged 16-24 were the top age group when it came to clothes and sports goods purchases (69 %), those aged 25-54 in buying household goods (49 %) and the older age group (55-74) in online purchases of travel and holiday accommodation (57 %).
In terms of frequency, the highest proportion of e-shoppers made purchases in the three months prior to the survey only once or twice (35 %). In terms of amount spent, the highest proportion of e-buyers (40 %) bought goods or services for a total of €100-499.
32 % of e-buyers purchased from other EU Member States, compared with 25 % in 2012.
Proportion of e-shoppers growing steadily, with the biggest increase among young people
Buying over the internet is very popular in the EU. The proportion of individuals aged 16-74 having purchased online in the 12 months prior to the survey stood at 55 % in 2016 (Table 1). Consumers appreciate the convenience of being able to shop anytime anywhere, having access to a broader range of products, comparing prices and sharing their opinion on goods with other consumers.
84 % of individuals aged 16 to 74 in the EU had used the internet in the 12 months prior to the survey, of whom 66 % had bought or ordered goods or services for private use. Online purchases by internet users increased by 16 percentage points compared to 2007 (Figure 1).
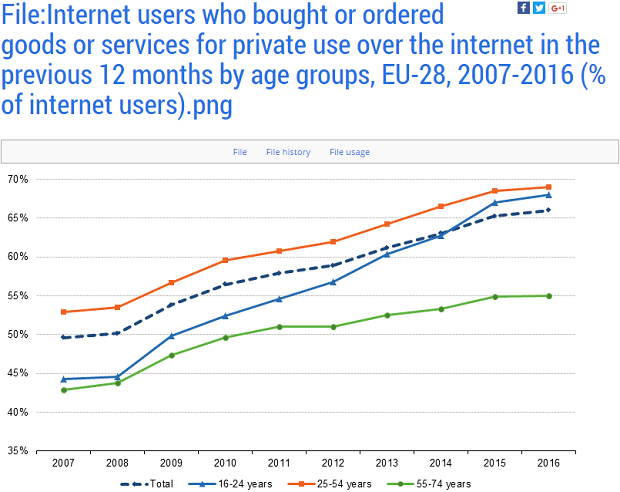
Those aged 25-54 had the highest share of online shoppers among internet users in 2007-2016. In 2015 the youngest age group (16-24) overtook the EU average level to almost reach the level of 25-54 year olds. E-commerce picked up over the 2007-2016 period among all age groups, with individuals aged 16-24 showing the biggest increase (24 percentage points).
Over eight in ten internet users in the United Kingdom (87 %), Denmark (84 %) and Germany (82 %) had bought or ordered goods or services over the internet in the previous 12 months. On the other hand, fewer than 40 % had shopped online in Cyprus (38 %), Bulgaria (27 %) and Romania (18 %). The largest (more than 10 percentage points) increases between 2012 and 2016 were recorded in Lithuania, the Czech Republic, Ireland, Hungary, Spain, Italy and Slovakia (Figure 2).
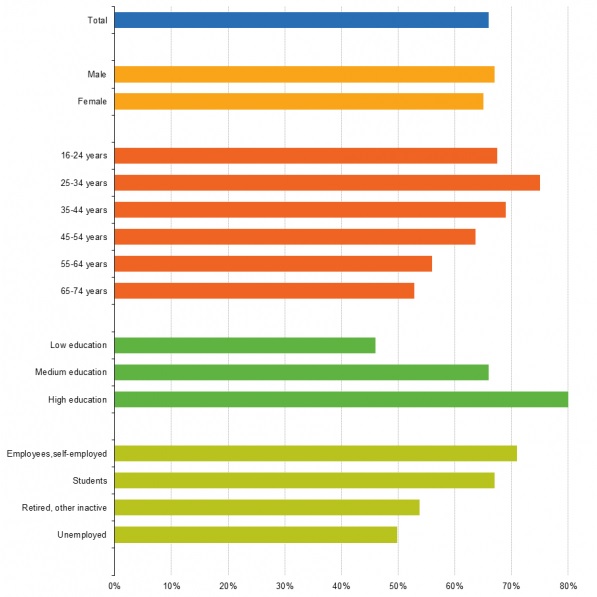
Gender, age, level of education and employment situation all affect e-commerce activity (Figure 3). For men, the share of online shoppers among internet users was slightly higher than for women (67 % and 65 %, respectively), while individuals aged 25-34 are more active e-shoppers (75 % of internet users) than other age groups. Among the internet users with higher level of education, eight in 10 bought goods or services online. Employees and self-employed internet users are more likely to buy or order goods or services over the internet (71 %) than unemployed internet users (50 %).
Fig. 3 – Internet users who bought or ordered goods or services for private use over the internet in the previous 12 months, EU-28, 2016 (% of internet users)
Clothes and sports goods predominate in online purchases
Figure 4 shows that most purchases, by a third or more of e-shoppers, involved clothes and sports goods (61 %), travel and holiday accommodation (52 %), household goods (44 %), tickets for events (38 %) and books, magazines and newspapers (33 %). Fewer than one in five internet users bought telecommunication services (18 %), computer hardware (17 %), medicines (13 %) and e-learning material (6 %).
Fig.4 – Online purchases, EU28, 2016 (% of individuals who bought or ordered goods or services over the internet for private use in the previous 12 months)
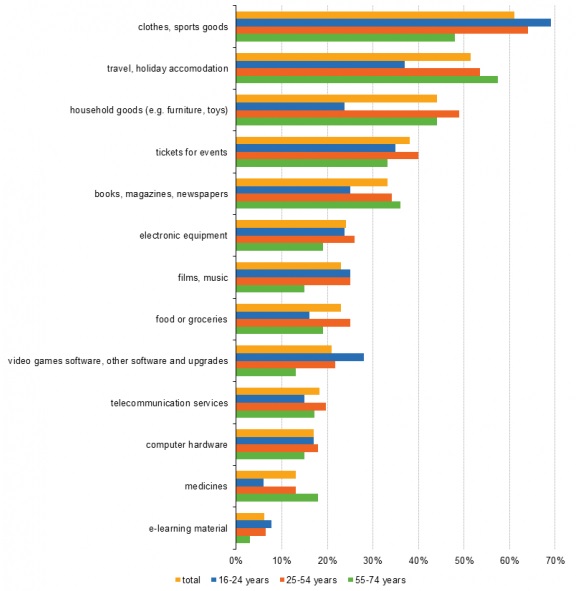
The 16-24 age-group had the highest proportions of e-shoppers purchasing clothes and sport goods (69 %), video games software, other software and upgrades (28 %) and e-learning material (8 %). People aged 25-54 had the highest proportion of internet users buying household goods (49 %), tickets for events (40 %), electronic equipment (26 %), food or groceries (25 %), telecommunication services (20 %) and computer hardware (18 %). The older (55-74) age group took the lead in buying travel and holiday accommodation (57 %), books, magazines and newspapers (36 %) and medicines (18 %).
About 35 % of e-shoppers had in the previous three months bought goods or services for private use once or twice and a third had done so three to five times. The proportion of e-shoppers who had made online purchases over 10 times was lowest, at 14 % (Figure 5).
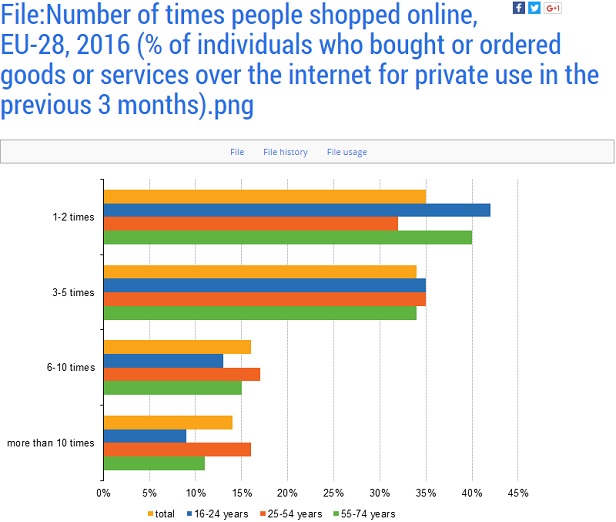
The largest proportion of people buying online once or twice is found among those aged 16-24 (42 % of e-shoppers), followed by individuals aged 55-74 (40 %). People aged 25-54 stand out as making more frequent purchases: 17 % of e-shoppers in this age group bought online 6-10 times in the three months prior to the survey and 16 % did so even more often.
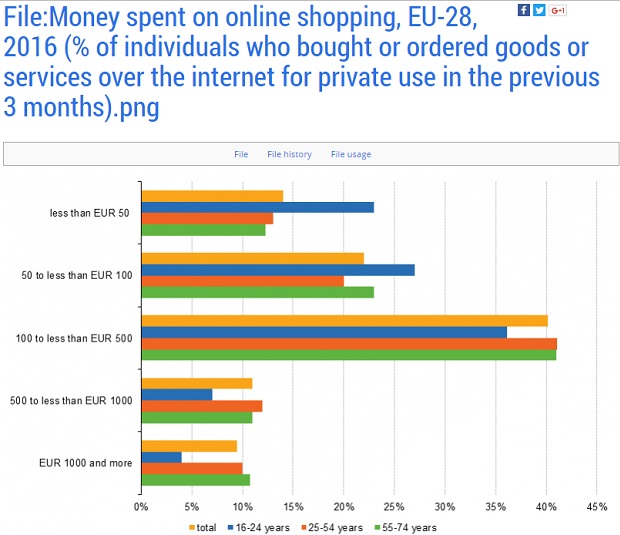
Four in ten e-shoppers said they had spent EUR 100-499 for their online purchases in the three months prior to the survey. Individuals aged 16-24 led in online purchases worth less than EUR 100 and those aged 25-54 and 55-74 for purchases of EUR 100-499. Purchases worth over EUR 500 were less popular with all age groups (Figure 6).
68 % of e-buyers reported to have no problem when purchasing online
Almost seven e-buyers out of ten reported that they did not encounter any problem when buying or ordering goods or services in the previous 12 months. The problems encountered most often by EU online shoppers were related to slower delivery than had been indicated at the time of making the purchase (17 %). Some 13 % had problems in the form of technical failure of a website while ordering or paying, 9 % had received wrong or damaged goods/services, 5 % had difficulties in finding information on guarantees and other legal rights and 4 % were confronted with final costs higher than indicated or found it difficult to make complaints and seek redress after a complaint. About 3 % of online shoppers in each case were confronted with foreign retailers not selling to customers in their country and problems with fraud (e.g. no goods/services received at all, misuse of credit card details).
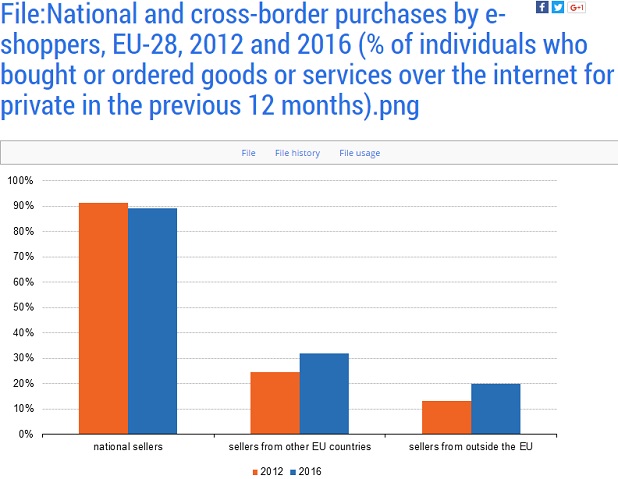
32 % of online shoppers bought or ordered goods or services from sellers in other EU countries
Cross-border online purchases can be an indicator of the smooth functioning of the single market for e-commerce and the extent to which consumers make use of wider choices and lower prices. A large majority of e-shoppers in the 12 months prior to the survey made online purchases from sellers in their own country: 89 %, i.e. down by 2 percentage points from 2012 (Figure 8). A rising trend is observed for purchases from sellers in other Member States (from 25 % in 2012 to 32 % in 2016) and from sellers outside the EU (from 13 % in 2012 to 20 % in 2016).
Data sources and availability
The data in this article are based on the results of annual surveys on ICT usage in households and by individuals. Data for 2016 were aggregated from micro data transmitted by all Member States and some non EU countries (Norway, the former Yugoslav Republic of Macedonia and Turkey).
The 2016 survey results are based on responses from a total of 156 152 households containing at least one person aged 16-74, and 203 798 individuals aged 16-74 across the EU. Individuals were asked about the last time they used the internet, how often they used it, on which devices, use away from home or usual place of work, activities relating to e-government and e-commerce, e-skills and privacy and protection of personal identity.
Most countries collected data in the second quarter of 2016. The reference period for the questions on frequency of online shopping and amounts spent was the three months prior to the survey. For data relating to the other e-commerce activities, the reference period was the 12 months prior to the survey, as such activities tend to be irregular and seasonal.
Source: Eurostat


Dariusz Mazurkiewicz – CEO at BLIK Polish Payment Standard
Banking 4.0 – „how was the experience for you”
„To be honest I think that Sinaia, your conference, is much better then Davos.”
Many more interesting quotes in the video below: