

The global payments industry demonstrated its resilience again in 2021, more than recouping the revenue erosion experienced in 2020, which was the sector’s first decline since the 2008–09 financial crisis. McKinsey five-year revenue outlook now exceeds prepandemic expectations, topping $3 trillion by 2026.
A2A transaction revenues continued to increase their contribution in most geographies, in total accounting for roughly 29 percent of 2021’s rise in global revenue, according to a report published by McKinsey. The expansion of applications built on instant-payment use cases—such as bill payment, point of sale (POS), and e-commerce—fueled the volume increase. Growth varies by country, with Hong Kong, Colombia, and Peru registering increases of roughly 50 percent and a tier of countries including Nigeria growing in the 30–40 percent range.
Many European countries continued to grow at rates well into double digits, even from well-established bases. In the US, growth rates for instant payments surpassed 60 percent, albeit off a relatively small base. At this stage of maturity, there remains room for a breakthrough that sparks an even higher US growth rate.
In Asia, pricing was a bigger revenue factor than volume growth. In 2021, China rolled back much of the corporate rate concessions implemented during the pandemic; prices moved from approximately $0.79 per transaction in 2019 to about $0.62 in 2020, returning to about $0.77 in 2021.
Overall, we project global growth of instant payments to continue at double-digit rates, even faster than the healthy 10 percent growth rates for cards over the past two years.
Debit and credit card transactions continued to grow at rates comparable to those before the pandemic (20 percent and 18 percent, respectively, between 2020 and 2021), as A2A growth mainly cannibalized cash and, to a lesser extent, checks, rather than card transactions. Credit cards’ volume growth overturned expectations that 2020’s slowdown in card usage and ongoing pressure on interchange revenue was a sign of a longer-term trend.
However, debit cards have extended their lead as the most used card product, with 94 transactions per capita globally, versus 49 for credit. The share of debit card among overall electronic transactions is highest in Russia (84 percent), followed by Norway, Ireland, and Romania (each roughly two-thirds).
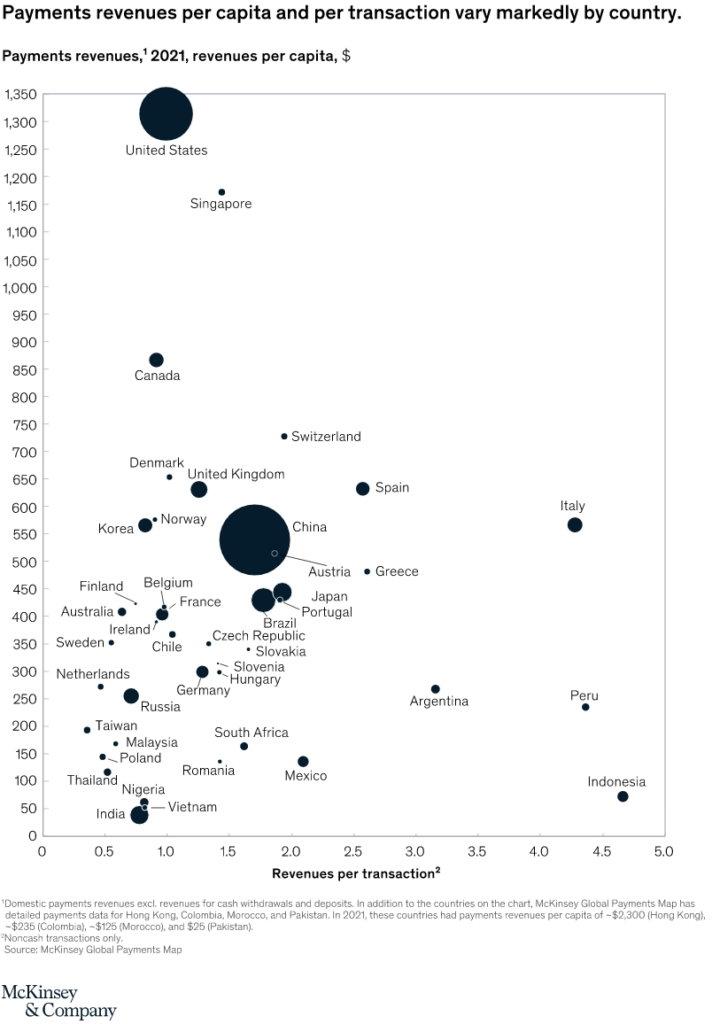
There remains significant country-level dispersion in revenue per transaction, driven by a variety of factors, including transaction pricing dynamics and payment instrument mix (graphic). Our analysis of payments revenue per capita shows that this metric tends to be lower in developing economies, implying ongoing revenue opportunity as these countries’ payment systems continue to mature. In addition, global revenue per non-cash transaction has gradually declined—from $1.88 in 2016 to $1.30 in 2021—as the pool of electronic transactions has grown faster than absolute revenue.
More details in this article: The chessboard rearranged: Rethinking the next moves in global payments


Banking 4.0 – „how was the experience for you”
„To be honest I think that Sinaia, your conference, is much better then Davos.”
Many more interesting quotes in the video below: